Software - Sodium Data
We performed quite some sodium spectroscopy in our labs. Please see some fancy pictures of our sodium FADOF here:
Therefore, we started to recalculate the sodium spectra from first principles. This was achieved by adapting a program from Joanna Zielinska and Morgan Mitchell from rubidium to sodium.
The program now allows to calculate the susceptibilities of the sodium spectra of the D1 and the D2 line. With the support of Morgan Mitchel and Joanna Zielinska, we release the program now for public use under the GNU Public License (GPL), version 2.0 or later.
Please find the program here: sodium_d1_d2.nb
Below are the optical spectra for 153°C and an optical path length of 100mm:
The above calculation takes quite some time (approx. 1 min on my notebook). Therefore, we calculated all susceptibilities for a range of -20 to 20 GHz of the line. The data can be found here:
The nomenclature is as follows: [d1|d2]_calc_[temp in Kelvin]["_small"|""].fits. I prohibit the directory listing of the files, since I do not want crawlers or robots to fetch the data (some GB!). A normal human visitor should know how to retrieve the files. Also the Mathematica notebook below can automatically fetch the relevant data, if the correct URL is changed from 'localhost' to 'gerhardt.ch'.
Everything was calculated in 2001 frequency steps (=20MHz per pixel, starting with -20GHz, last pixel is 20GHz). This is nice for lineplots etc.. The magnetic field is varied up to 400mT.
For multidimensional plots this is way too much. Therefore, a downsampled version with 285 frequency steps is available. This is called [d1|d2]_calc_[temp in Kelvin]_small.fits.
Still, this is quite some data. If you want, you can drop me a line and I will send you a free DVD with all these FITS files for no charge.
To calculate the final spectra from these FITS files, you can use our Mathematica file: sodium_fadof_spectra_01.nb
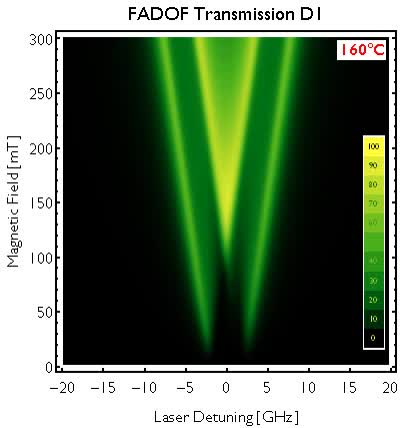
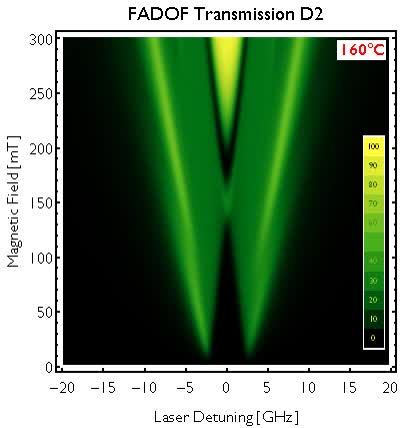
Here are the images, calculated with the above program:
Videos of the Sodium FADOF for different temperatures and magnetic fields